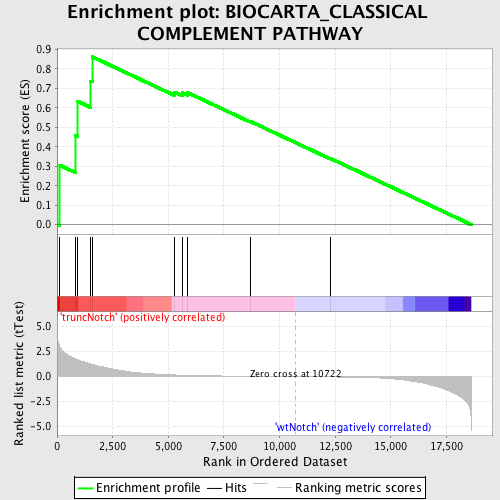
Profile of the Running ES Score & Positions of GeneSet Members on the Rank Ordered List
| Dataset | Set_03_truncNotch_versus_wtNotch.phenotype_truncNotch_versus_wtNotch.cls #truncNotch_versus_wtNotch |
| Phenotype | phenotype_truncNotch_versus_wtNotch.cls#truncNotch_versus_wtNotch |
| Upregulated in class | truncNotch |
| GeneSet | BIOCARTA_CLASSICAL COMPLEMENT PATHWAY |
| Enrichment Score (ES) | 0.86204594 |
| Normalized Enrichment Score (NES) | 1.5595148 |
| Nominal p-value | 0.012844036 |
| FDR q-value | 0.38442475 |
| FWER p-Value | 0.978 |
| PROBE | DESCRIPTION (from dataset) | GENE SYMBOL | GENE_TITLE | RANK IN GENE LIST | RANK METRIC SCORE | RUNNING ES | CORE ENRICHMENT | |
|---|---|---|---|---|---|---|---|---|
| 1 | C2 | 5390465 | 126 | 2.930 | 0.3049 | Yes | ||
| 2 | C1QC | 5700131 | 815 | 1.798 | 0.4592 | Yes | ||
| 3 | C1QA | 5390687 | 921 | 1.694 | 0.6338 | Yes | ||
| 4 | C3 | 1740372 | 1500 | 1.267 | 0.7375 | Yes | ||
| 5 | C1QB | 5910292 | 1586 | 1.214 | 0.8620 | Yes | ||
| 6 | C1R | 2340025 3290152 4850452 | 5280 | 0.167 | 0.6813 | No | ||
| 7 | C6 | 1770154 2900129 | 5624 | 0.141 | 0.6779 | No | ||
| 8 | C8A | 2190601 | 5873 | 0.126 | 0.6780 | No | ||
| 9 | C9 | 5550452 5690253 | 8672 | 0.035 | 0.5313 | No | ||
| 10 | C8B | 6770687 | 12266 | -0.029 | 0.3413 | No |

